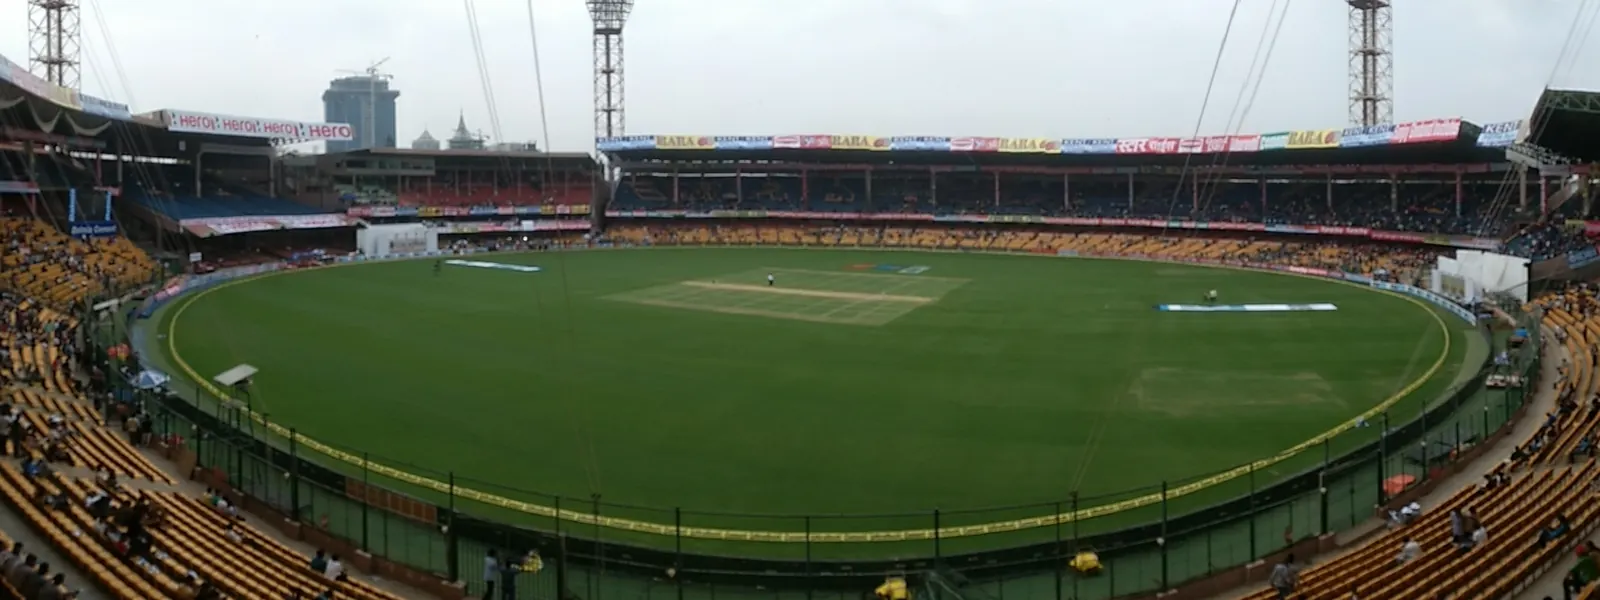
Venue · Bengaluru
M Chinnaswamy Stadium
104 IPL matches · 2008–2026 · last 24 Apr 2026
Photo: Aniket Suryavanshi from Solapur, India, CC BY 2.0 via Wikimedia Commons
Par 1st inns 2023+
190
all-time 176 · n=24
Median 1st inns 2023+
188
all-time 175
Avg 2nd inns 2023+
182
all-time 162
Chase win 2023+
54%
all-time 56%
Toss winner won 2023+
54%
chose field 100%
Matches 2023+
24
104 all-time
Par score
2023+ vs all-time
| Measure | 2023+n=24 | All-timen=97 | Change |
|---|---|---|---|
| Par 1st innings (avg) | 190 | 176 | +14 |
| Median 1st innings | 188 | 175 | +13 |
| Avg 2nd innings | 182 | 162 | +20 |
| Chasing side won | 54% | 56% | −2 |
| Batting first won | 46% | 44% | +2 |
Scoring has inflated since 2022. League powerplay run rate went 7.8 (2022) → 10.1 (2026) with the impact-player rule, so all-time averages understate today’s par. Plan with the 2023+ column or the recency-weighted par of 188.
Average 1st-innings score by season
156
169
156
175
162
180
179
195
142
187
180
196
197
169
195
'08'11'13'15'17'19'24'26
Solid bars: 2023+ (impact-player era). Axis starts at 110.
Toss and chase by season
- Chose to field %
- Chase won %
Highest totals
All IPL seasons
- 1Sunrisers Hyderabad v RCB15 Apr 2024 · 1st innings287/320 ov
- 2Royal Challengers Bengaluru v PWI23 Apr 2013 · 1st innings263/520 ov
- 3Royal Challengers Bengaluru v SRH15 Apr 2024 · 2nd innings262/720 ov
- 4Royal Challengers Bengaluru v CSK5 Apr 2026 · 1st innings250/320 ov
- 5Royal Challengers Bengaluru v GL14 May 2016 · 1st innings248/320 ov


Lowest totals
Completed innings
- 1Rajasthan Royals v RCB18 Mar 2010 · 1st innings9219.5 ov
- 2Kolkata Knight Riders v MI19 May 2017 · 1st innings10718.5 ov
- 3Rajasthan Royals v RCB20 Apr 2013 · 1st innings11719.4 ov
- 4Kochi Tuskers Kerala v RCB8 May 2011 · 1st innings125/920 ov
- 5Royal Challengers Bengaluru v PBKS5 May 2008 · 1st innings12619.2 ov


Top run-scorers here
All IPL seasons
Top wicket-takers here
All IPL seasons