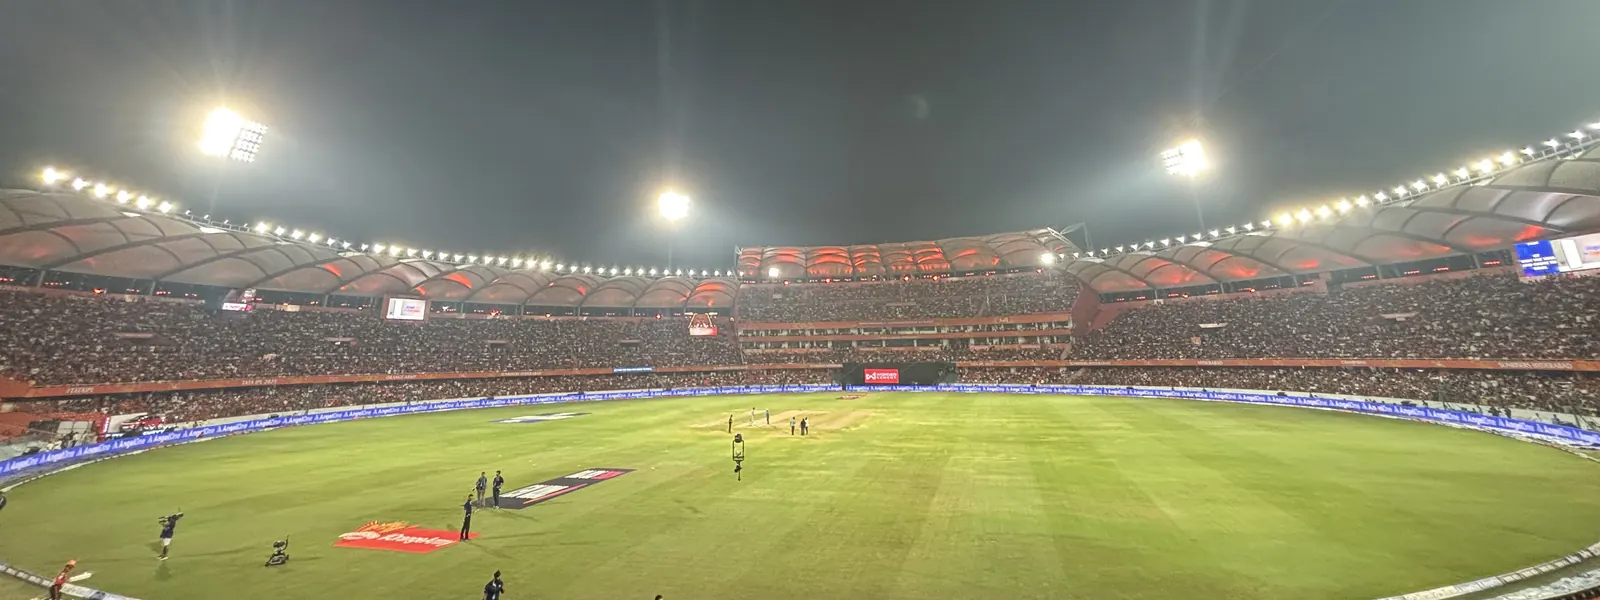
Venue · Hyderabad
Rajiv Gandhi International Stadium
90 IPL matches · 2008–2026 · last 22 May 2026
Photo: Naren.Ayinala, CC BY 4.0 via Wikimedia Commons
Par 1st inns 2023+
197
all-time 170 · n=25
Median 1st inns 2023+
192
all-time 165
Avg 2nd inns 2023+
182
all-time 159
Chase win 2023+
48%
all-time 54%
Toss winner won 2023+
48%
chose field 62%
Matches 2023+
25
90 all-time
Par score
2023+ vs all-time
| Measure | 2023+n=25 | All-timen=86 | Change |
|---|---|---|---|
| Par 1st innings (avg) | 197 | 170 | +27 |
| Median 1st innings | 192 | 165 | +27 |
| Avg 2nd innings | 182 | 159 | +23 |
| Chasing side won | 48% | 54% | −6 |
| Batting first won | 52% | 47% | +5 |
Scoring has inflated since 2022. League powerplay run rate went 7.8 (2022) → 10.1 (2026) with the impact-player rule, so all-time averages understate today’s par. Plan with the 2023+ column or the recency-weighted par of 197.
Average 1st-innings score by season
173
161
154
135
166
163
149
165
152
172
174
205
203
209
'08'12'14'16'18'23'25
Solid bars: 2023+ (impact-player era). Axis starts at 100.
Toss and chase by season
- Chose to field %
- Chase won %
Highest totals
All IPL seasons
- 1Sunrisers Hyderabad v RR23 Mar 2025 · 1st innings286/620 ov
- 2Sunrisers Hyderabad v MI27 Mar 2024 · 1st innings277/320 ov
- 3Sunrisers Hyderabad v RCB22 May 2026 · 1st innings255/420 ov
- 4Sunrisers Hyderabad v PBKS12 Apr 2025 · 2nd innings247/218.3 ov
- 5Mumbai Indians v SRH27 Mar 2024 · 2nd innings246/520 ov


Lowest totals
Completed innings
- 1Delhi Capitals v SRH4 May 2013 · 1st innings8019.1 ov
- 2Sunrisers Hyderabad v MI17 May 2015 · 1st innings11320 ov
- 3Punjab Kings v SRH19 Apr 2013 · 1st innings123/920 ov
- 4Rajasthan Royals v SRH9 Apr 2018 · 1st innings125/920 ov
- 5Rajasthan Royals v SRH18 May 2012 · 1st innings126/820 ov



Top run-scorers here
All IPL seasons
Top wicket-takers here
All IPL seasons